Lab 2: Geospatial Web Services
Goals and Background:
Lab 2 consisted of many sections that attempted to guide the
user through the developer process of uploading web applications to an online
platform. This lab would utilize ArcGIS Online, ArcGIS Pro, and as well as the
traditional ArcMap. The steps one must go through to complete this lab
eventually lead to an understanding of how the publishing process works.
Various paths were taken to connect to the online platform ArcGIS Online. While
ArcGIS Online is a powerful tool, it is limited in certain aspects of manipulating
geospatial data. Lab 2 solved this conundrum by using desktop versions of GIS
platforms.


Methods:
Part I
The first objective of this lab was to publish a feature hosted service using a shapefile through ArcGIS Online. This was accomplished by first downloading the zip file that contained all the relevant data from the University of Wisconsin – Eau Claire’s (UWEC) D2L website. Once within ArcGIS Online, the “Wisconsin_transportation.zip” was uploaded from the desktop. This data was then used within a user-created map that detailed the interstate and highway systems of Wisconsin.
Next, as opposed to using a geospatial file such as a shapefile, a comma-separated values (CSV) file would be used for map creation within ArcGIS Online. The file that would be used, “WI_fire_occ_2004”, was originally a Microsoft Excel file. It was easily converted into a CSV file by saving it as one within Excel itself. Using latitude and longitude as the coordinate system allowed ArcGIS Online to recognize the attached values and affix their location to somewhere in Wisconsin.
The final section of part one dealt with publishing a feature hosted service using an ArcMap document. ArcGIS Online is somewhat limited in its ability to edit certain cartographic features. This limitation can be overcome by using ArcMap on desktop to do most of the editing. After signing into ArcGIS Online while within ArcMap, “Rivers_and_streams” and “Lakes” feature classes were added to the document. Similar to the CSV file, whilst connected to ArcGIS Online, one can upload the map document directly into the web service. After allowing the querying capability, the Service Editor had to be ran to check for errors. In this case, zero errors were shown and the map was published as a service. Topographical features were edited and a new map was created.
Part II
Part two of this lab involved publishing a tiled map service using ArcGIS Server. Instead of publishing to ArcGIS Online, this process would publish a server to an ArcGIS Server owned by the Department of Geography and Anthropology at UWEC. A database connection had to be established within ArcMap first. After an authentication process using UWEC credentials, the user would now be connected to the server. A user-owned geodatabase would be accessible and now raster data would be uploaded into an ArcMap document.
To be able to eventually publish the service ArcGIS Online, a connection to the ArcGIS Server Services Directory had to be made. UWEC’s could be found at http://geog01.uwec.edu/server/rest/services. As this was a raster dataset that involved land use within the Eau Claire area, the service must use tiles from caching as ArcGIS Online cannot display standalone raster data. The service was then analyzed for errors and finally published to ArcGIS Online.
A new project would be published through ArcGIS Pro to ArcGIS Online. This would be an almost identical process to publishing through an ArcGIS Server that was completed previously using the same geospatial data.
Part III
The third and final part of this lab was three tasks: author a map document, create a feature service, and add to a web map. Previously collected data on hurricanes and earthquakes in the United States from NASA and NOAA would be used in this part of the lab. Simple cartographic editing was performed on this data while in ArcMap, save for a crucial element. Time as an attribute would have to be enabled on each layer of earthquakes and hurricanes. After this was done, the map would be published as a service to the UWEC server. This service was then added into ArcGIS Online by adding a layer from web, the URL would be gathered from ArcGIS Server Directory. After a few features needed to be edited for display purposes, the lab was finished.
Results:
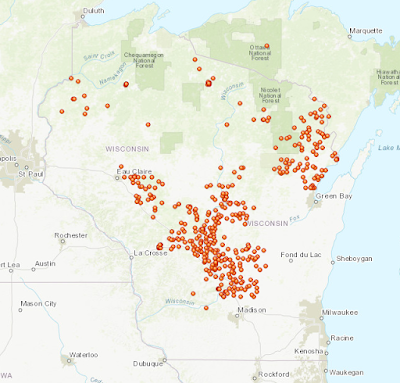
The first service that was created in this lab showed fires in the state of Wisconsin from 2004. This service (Figure 1) was based upon a shapefile that was uploaded to ArcGIS Online. Pop-ups had to be configured to only show attribute data for the date of the fire. This service can be found at the following URL: http://arcg.is/0K99Ga

(Figure 1) This map displays fires that occurred in the state of Wisconsin for the year 2004.
The next service that was created using provided data displayed the various waterways and waterbodies in the state of Wisconsin. This service (Figure 2) had to be edited to show waterways and lakes in more aesthetically pleasing colors as well as pop-ups that had to be configured. This service can be found at the following URL: http://arcg.is/9Xnni

(Figure 2) This map displays water bodies in the state of Wisconsin. The "Lakes" feature class is symbolized by a darker blue than the "Rivers and Streams" feature class.
The third service created from this lab showed zoning classes of the Chippewa Valley in western Wisconsin. Figure 3 details land use such as commercial and residential areas for the three cities of Altoona, Chippewa Falls, and Eau Claire. This service can be found at the following URL: https://tiles.arcgis.com/tiles/gK4swK4xfdoKv59p/arcgis/rest/services/Chippewa_valley_urban_corridor_Loftsgaarden/MapServer

(Figure 3) This map land use within the Chippewa Valley. The red portions of this map are the residential areas of the three cities and dominate the central belt.
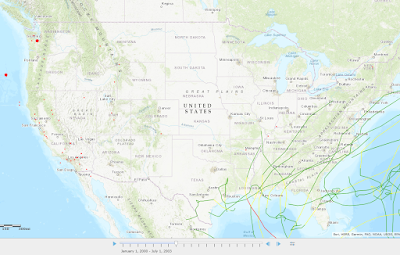
The final and most intricate service that was created through this lab is displayed below (Figure 4). It has time enabled data that allows an end-user to pinpoint moments in time certain natural disasters within the United States. This service can be found at the following URL: http://arcg.is/00z89f

(Figure 4) This image displays a snapshot of the time enabled data for natural disasters in the United States. Note the time stamp that is displayed in the center portion of the image.
Sources:
\EsriPress\GTKWebGIS\Chapter3\Data.gdb\Earthquakes, courtesy of USGS National Atlas. \EsriPress\GTKWebGIS\Chapter3\Data.gdb\Hurricanes, courtesy of NOAA National Climatic Data Center
Wisconsin DNR, 2013
Wilson, Cyril unpublished data 2012 and 2016
Comments
Post a Comment