Lab 1: Cloud GIS Basics
Goals and Background:
The goal of this lab was to familiarize oneself with the ArcGIS Online platform as both a developer and an end user. ArcGIS Online is accessible to a much wider audience than that of the traditional ESRI ArcMap platform on a desktop computer. Due to ArcGIS Online’s simpler interface and reduced requirements regarding a device’s hardware, this platform is on the forefront of GIS technology.This lab was separated into three parts. The first part of the lab dealt with how an end user might see the content and to delve into the core functions of ArcGIS Online like its sharing features and interactive legend. The middle section of the lab was a simple walk-through of the map creation process through a developer’s perspective. The final part was the most labor intensive portion of this assignment. The task was to create a story map of a University of Wisconsin – Eau Claire (UW-EC) geography class field trip that took place in Texas by uploading pictures as well as coordinate data like latitude and longitude.
Methods:
Part I
The first part of this lab required one to log-in to the ArcGIS Online service by using their UW-EC credentials. Once logged on, the UWEC group was accessible through a web browser, in this case Google Chrome. Then, the next step was observing the various features of the map entitled “Hawaii Island Lava Flow Risk”. This map was created by Learn_ArcGIS and came preloaded with observable features such as hazard zones and road systems. After looking at the metadata and answering a few questions, the next task was to implement some basic customization to the map. The main objective was to change the highway feature class so it would be more cartographically important. In this case, the highway feature class was set to be only observable once zoomed in to a larger scale as it did not pertain as much to the volcanoes. The customized map was then saved and shared with the Geography 455 group.Part II
This portion of the lab would recreate the “Hawaii Island Lava Flow Risk” map from the ground up. The first step in this process was to add a topographic base map of the island Hawaii. After adding the base map, layers would be added to the map utilizing the search function on ArcGIS Online. The layers HawaiiLava Flow Hazard Zones, Volcanoes, HawaiiTerrain, Hawaii Island Major Highways, and Emergency Shelters were all added to the basemap. This would be the only data that would be needed.The next steps would be some general maintenance of the map to make it aesthetically pleasing. The layers in the content pane would become simpler, losing the Hawaii moniker in most cases. The Emergency Shelters feature would be edited to distinguish itself from the Volcanoes feature class. Finally, the map was saved with personal credentials attached.
Part III
Upon reaching the final section of the lab, instructions on how to create a story map were presented. According to ESRI, story maps “combine authoritative maps with narrative text, images, and multimedia content.” (2017) The first step in this process would be downloading a zip file that was provided. This zip file contained pictures (in JPEG), descriptions, and coordinates for each stop of the UWEC Geography 368 Field Seminar class field trip to Texas.Next, ArcGIS Online was opened and a new map was created. After zooming to the immediate area around Austin, Texas, a topographical base map was added. To continue the story map creation process, the “Create Web App – Using a Template” function was selected. This presented multiple templates that could be utilized for a story map. In this case, the “Story Map Tour” was chosen as instructed and the “CREATE WEB MAP” option was selected.
The bulk of time for this assignment was devoted to dragging and dropping the ten JPEG images that were provided into ArcGIS Online. Names of the location, a quick description, and coordinates were all required to be added to each photo. Once this process was completed, the final step was to save and share the application.
Results:
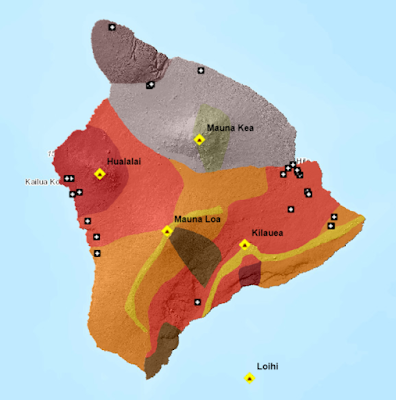
The first online map (Figure 1) that was produced was for the most part entirely created by Learn_GIS. However, this map had the highway feature class changed so it could only be visible at a larger scale to fit the cartographic theme of the application. This map displays the hazard lave flow zones of the various volcanoes that populate the large island of Hawaii. This map can be found at the following link:http://uwec.maps.arcgis.com/home/item.html?id=4f5fb6d221254bb1aa132189bd23c667#overview
(Figure 1) This image is the first map created in the lab. Note the elevation layer that gives the fuzziness beneath the hazard layer.
The second online map (Figure 2) performed a very similar function to previous map. However, in this one, the highway feature classes were not edited and the emergency shelters were changed so they would only be seen at larger scale. This map can be found at the following link:
http://uwec.maps.arcgis.com/home/item.html?id=5f2fbe4ee0244cd59166fee87ddeead6
(Figure 2) This image is the second map created in the lab. Note the elevation layer is absent in this layer when compared to Figure 1, hence the smoother hazard feature layer.
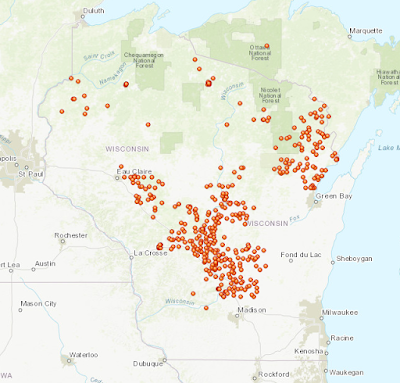
The final piece of work that was created from this lab was the story map for the UW-EC Geography 368 Field Seminar class field trip to Texas (Figure 3). Each point on the map has unique information affixed to its geographic location. The points on the map are color-coded. A red marker denotes a lecture or learning opportunity taking place in the photograph. A blue marker represents a photo of a waterway. Green indicates natural features like flora and fauna. This web application can be found at the following link:
http://uwec.maps.arcgis.com/apps/MapTour/index.html?appid=60f20e9dfcea46ecbff432f84387fe50
(Figure 3) This image is the story map that was created in Lab 1. The numbers over each marker were in the order that the JPEG's were uploaded into the web application.
Sources:
ESRI. (2017). ArcGIS Online [Online Platform]. Available from https://www.arcgis.com/home/index.htmlESRI. (2017). [Part of graphic illustrating the story map tour]. Story Maps. Retrieved from https://storymaps.arcgis.com/en


Comments
Post a Comment